Week 13: Further Findings + Revisions
- angelique perez
- Dec 10, 2024
- 5 min read
Updated: Dec 15, 2024
Revisions
In class this past week, I was given some revisions to my video. The first revision made was removing all the dates from across the videos. The studies that I chose were done within the last 5 years (2021 onwards) so some of the data is older than the rest. The dates were also removed so that the video feels cohesive. A couple revisions were made to the flashcards in the East v.s. West Usage section. I slowed down the movement of the cards by a lot, since it was agreed upon that they were moving too quickly. After finishing that, I also edited the flashcards themselves, adding their Unicode number underneath every emoji used. The final revision I made would be to my reference pages, where I added my own name to the list of sources.
Here is the revised thesis video!
Shown here are some poster ideas which are my companion pieces for the project.


Further Findings
After the midterm, I continued working on my videos and assets for the project. While moving forward, I came across more difficulties while working on the project. I realized that I would have to make some changes concerning my research, as well as my type & color choices. For the research, I realized that my final two sources were not very straightforward to represent through a motion graphic. After looking through some more sources, I found ones that were on the same line as the original, but went into more detail about numbers and specific emoji usage cases. For example, the video about Men v.s. Women usage cases could become difficult to represent without falling into stereotypes. That’s why I decided on a source that focused more on the different situational use of the emojis rather than the frequency of their use. For my final video (East v.s. West) I changed the source because I thought this one would be more straightforward to understand. It focuses on the cultural differences that might lead to different emoji frequencies. Which had an interesting data set paired with it, going over the different usage cases in the East/West. Besides these two, my remaining sources did not change. In the following text, I go through my videos to explain the visuals and thought process behind each video.

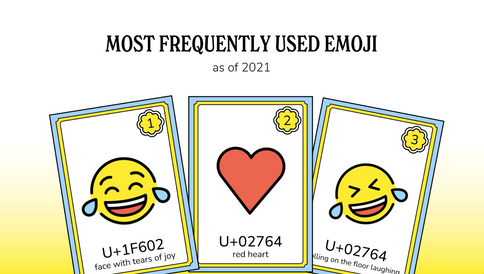


For the first video I made, I stuck with the Unicode study Emoji Frequency – Unicode. This was the first video shown in the final project. This video remained mostly the same, besides some quick edits at the end. I created a set of playing cards for the top ten most frequently used emojis and included their Unicode number on the card. I animated them so that it would somewhat mimic them being shuffled around. At the end I have the top three most frequently used pop up after stacking on them to once again mimic card games a bit. I think that for this sort of data benefits from a visualization like this because all the information is clear and grouped. After critique, I removed the year the study was preformed in and moved everything within the Title-Action Grid.

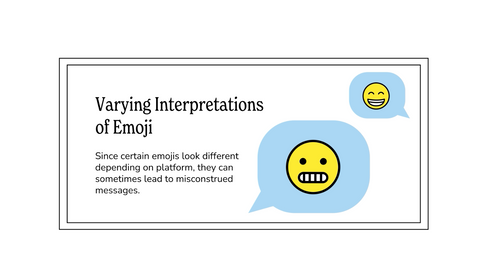


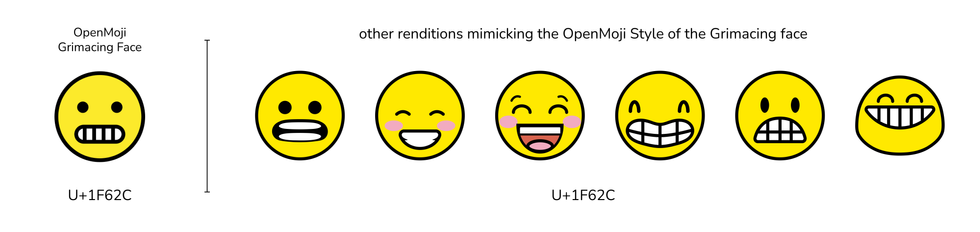
For my second video, I referenced (PDF) "Blissfully happy" or "ready to fight": Varying Interpretations of Emoji. This video was focused on different understandings of the same emoji (the grimacing emoji) since it appears different depending on what device the user has. For this project, I made emojis mimicking OpenMoji style in order to show the differences in between the representation of all the emojis. This video is supposed to mimic a text conversation where someone misunderstands a message about awkwardness, using the grimacing emoji to relay that. After that, it zips around onto different variations of the same emoji to try to show all the miscommunications that can happen due to the differences in emoji across platforms.


For the third video, Emoji usage by country, my source was Learning from the Ubiquitous Language. It shows the countries with the highest overall emoji usage along with the circle visual which represents how each area comes out in emoji usage (United States being huge v.s. Colombia, which is the smallest circle on the chart). I decided to do the circles as the representation for the usage since they are fairly straightforward to understand, yet show the data in a digestible way. I was having trouble with finding a way to display all the flags without the page getting too crowded, and I’m satisfied with how it came out.


For my fourth video, I referenced The Difference in Emoji Usage Between Genders | Atlantis Press. This deviated from my original source, since the original one I had picked would not have been visually interesting. I decided on this one because of it’s focus on the different usage of the emojis themselves rather than popularity across genders. The video starts with both text bubbles popping up, having the same text but a different emoji at the end. The gender of the messenger is revealed, and then the video goes into the tendencies of how men and women text. I chose to do this section in a graphically simple way because I did not want to somehow adhere to stereotypes and incorrectly present the data.


For my fifth video, my source was Machine Learning Detects Cross-Cultural Similarities. and Differences in Emoji Usage. I chose three sections from the biological processes section of the data set, Health, Ingest, and Sexual. These three sections of the video go over some differences in emoji usage by category in the Eastern and Western world. I decided to go with flashcards to get the point across, since they’re fairly simple and well-known. Each flashcard contains a Unicode number as well as clarification to as if it’s representing the East or West.

I also made a couple of changes to the overall design rules I set for myself at the beginning of the project. Originally, I was going to use the fonts Nunito and Nunito Sans for the entirety of the project, but I decided on adding a font (New Spirit) to use for titles so that there would be more contrast. Additionally, I added to my initial color pallet, which is shown under Section A. Section B has some brighter colors, which were helpful to avoid having things look washed out.
Final Thoughts
In the future, I think I would like to make a small booklet of some sort to go along with the project. I think it would be a nice addition, since a lot of the data intricacies are lost within the video form. It wouldn't have to be too big, just enough to cover the main crux of each data set. This is more immediate, but I would also like to make the playing & flashcards from my videos into the real thing. I think it would also make an enjoyable addition since it would be something tangible to experience with the project.
I learned a lot while working on this project. The data sets contained a lot of interesting information about something I had not thought to look into so deeply before. Every one of the data sets included fascinating & unexpected pieces of information. I really enjoyed creating these sorts of graphics about pre-established data sets, so I think that it’s something I may explore in the future. I learned about the Title-Action Grid, which was actually a great help in keeping everything in track and lined up throughout my project. It really helped me keep my sizing consistent across the videos. Another thing I learned I needed to work on was my file management. Usually, my files live on my desktop, which quickly became a mess. That sort of mess does not benefit my After Effects files, so I made sure to keep everything neat and tidy for the duration of this project. Specifically, making folders within After Effects and making sure not to get lost in compositions and images.


Comments